
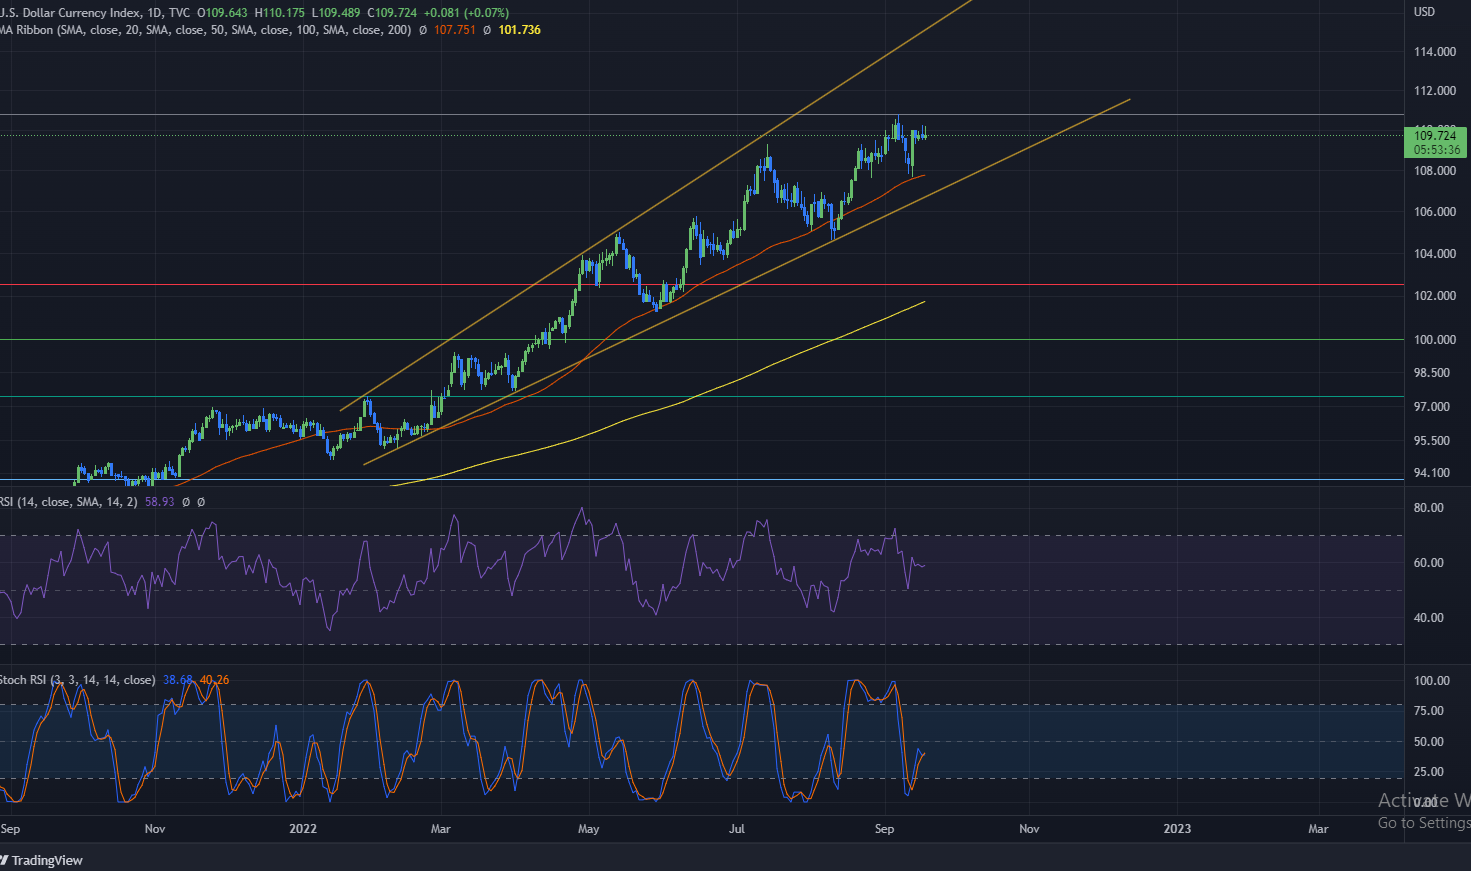
Looking back at weekly analysis number 1, Bitcoin ended up breaking the wedge on the 4 hour and going to the upside while in just less than a week going down to lower levels. The picture above shows the dollar in a broadening wedge on the daily, while this is a bitcoin analysis it’s important to look at the bigger underling picture before jumping into the whole of the bitcoin analysis. From time and time again the dollar index (DXY) has used the bottom of the broadening wedge 5 times as support while also using the 50 day moving average as support to not break down to lower levels. Since the beginning of 2022, DXY has went up 17%, an abnormal number that has caused traders to believe that the dollar top is near. The meaning of this high dollar price indicates that traders and governments have flocked to the dollar as a hedge to inflation because of other currencies that have taken huge hits like the Euro down 14.2%, Yuan down 10.3%, even the Japanese Yen down 22%. With other investments worldwide running to the dollar, the supply is slowly shrinking with the FED taking the dollar away from the circulating supply, creating more demand. If the dollar were to crash in the near future it would take other currencies and securities down even further with it. Currently on a daily chart the dollar made a higher high and will soon be testing the previous high as support which if it breaks down, it could retest the bottom of the broadening wedge or the 50 day moving average.
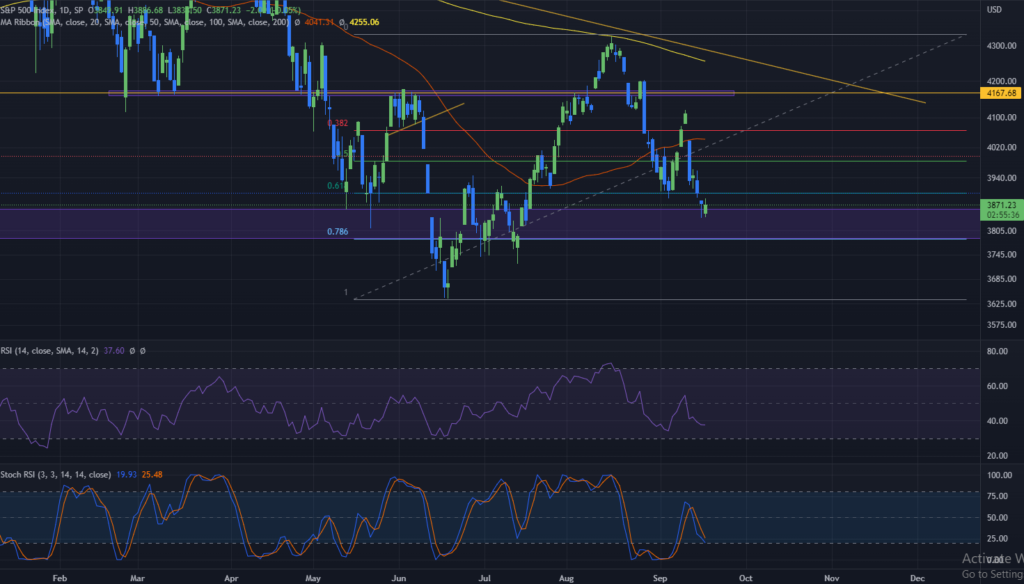
The S&P is down 20.5% from its high, on the daily timeframe its made a lower low and is about to retest the .618 Fibonacci level. This Fibonacci level is the most important level out of of 7 that are on the chart, testing and failing to break above this level while having a lower low on the chart will lead to a high chance of testing the bottom of the S&P at a price level of 3636. If the dollar is to keep going up further and the S&P breaks past the .618 level, it could potentially test the high of 4120 or better yet a critical level at 4167 that could make or break the S&P. For now, there is a potential for the S&P to go up because of the daily bullish divergence that hasn’t played out yet which can lead Bitcoin to go up in price in the short term if this were to happen.
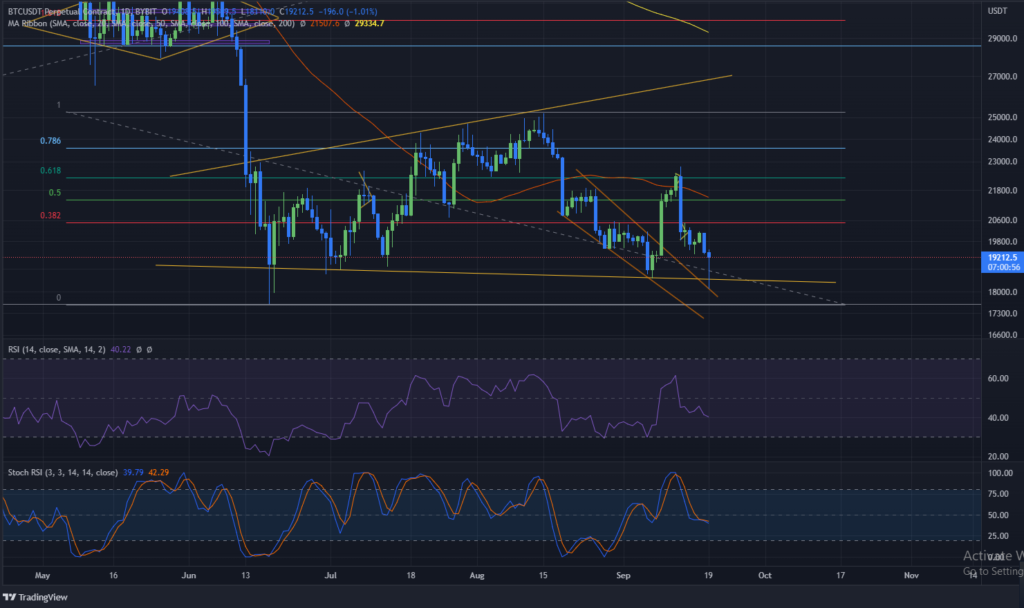
Bitcoin has respected this current broadening wedge for quite a bit, reacting with bullish momentum from hitting the bottom of it yet again. What’s interesting is bitcoin hit the bottom of the descending wedge (in orange) before making its ascent back up above 19,000. The move up after breaking the descending wedge caused BTC to go up 22.45% but with the CPI readings that the FED announced, this caused markets to stumble leaving BTC down 20.6%.
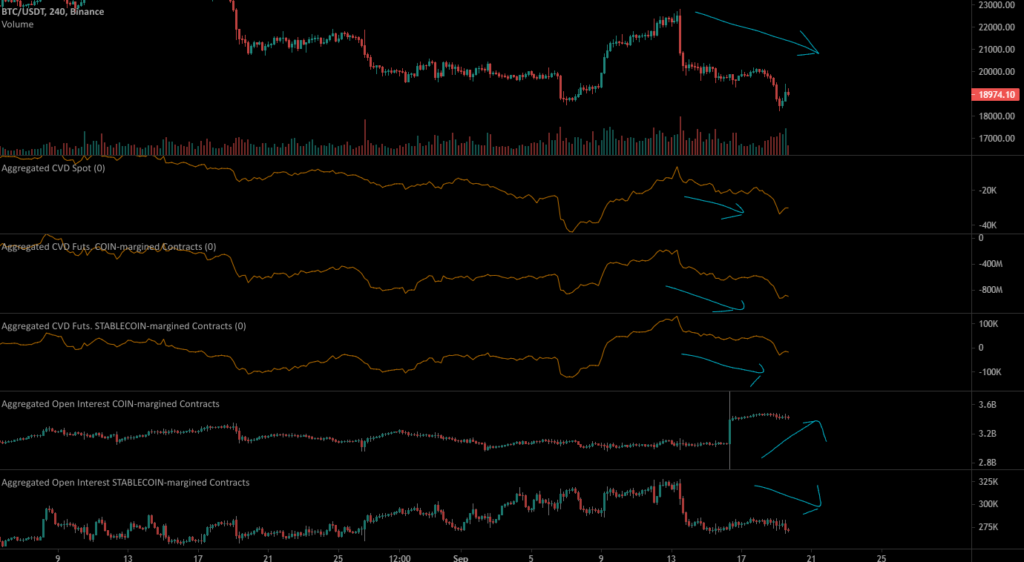
Cumulative Volume Delta (CVD) is the total trading volume in either Spot (buying bitcoin itself) or futures (betting on bitcoin going up or down). On a 4 hour view, people have been selling bitcoin on spot and shorting bitcoin using future contracts either with a dollar pair or a stable coin pair. Open Interest is the total amount of positions that are opened as of now. In just 3 days open interest for coin margined contracts (meaning total positions of shorts/longs that are currently opened) went up by 500 million dollars. Putting both indicators together it shows a story for the bigger picture of what total traders are doing. When the price of bitcoin went up from 18400 to 22800, CVD for spot and futures started going up, this means that people were buying and longing bitcoin. What’s interesting is Open interest for both stablecoin-margin contracts and coin-margined contracts stayed stagnant, this indicates that as people were starting to buy bitcoin and long it, there were almost no new positions being added into the market at that time. The positions that were added to the market mostly came from stablecoin-margined contracts, once bitcoin went down from 22800 to 19600 all the new people entering positions got liquidated from over longing bitcoin causing a long squeeze. Currently everyone is selling their bitcoin and shorting but now with 500 million dollars worth of positions added to coin-margined contracts by a whale, people are anticipating a move up to trap all the shortening positions that shorted the bottom of the price. Taking all this information in mind from the dollar index to what bitcoin traders are currently doing, it’s very likely that there could be a further price fall caused by the downfall of the S&P. If the S&P were to break the .618 Fibonacci line bitcoin could go up in price and all those new open interest positions can trap shorts leading to a powerful move up.