PepsiCo is one of the world’s largest food and beverage conglomerates, with a whopping market cap of about 239 billion dollars. The company splits itself into seven principal subsidiaries/regions, being Frito-Lay North America, Quaker Food North America, PepsiCo Beverage North America, Latin American (LA) Food and Beverage, European (EU) Food and Beverage, African/Middle Eastern/South African (AMESA) Food and Beverage, and Asia Pacific/Australian/New Zealand/China (APAC) Food and Beverage. It’s important to note that these seven divisions can be quantified into further subsidiaries that generate global revenue. This article will showcase the changing trends in PepsiCo over time and analyze the conglomerate’s health in the long term.
PepsiCo has 1.387 billion shares outstanding, with a current price of $173 per share. The conglomerate holds 8.42 billion dollars of liquid assets, including cash and cash equivalents, short-term investments, and investments in noncontrolled affiliates (investments in other companies where the company holds significant ownership with no controlling interest). In addition, there are over 39 billion dollars in long and short-term debt, which gives PepsiCo an Enterprise Value of over 270 billion dollars; if a company were to buy out PepsiCo, they must overpay by 30.6 billion dollars.

On a quarterly basis, PepsiCo made 27.996 billion dollars in revenue, up 11% from Q4 of 2021. Annually, revenue in 2022 equated to 86.39 billion dollars, making Q4 one of the best production quarters in history. Revenue has continued to grow for five consecutive years, leaving PepsiCo with a 32% increase year-to-year starting from 2017. Image one shows the total amount of revenue disbursed through each subsidiary; almost every sector has seen revenue growth over five years. Some, however, have seen higher revenue growth, including AMESA with 75% and APAC with 66%, as opposed to the EU with 21%. The EU had one of its weakest years in revenue, with a loss of 2% year to date. Despite the EU’s revenue decline, it is the third largest subsidiary inside of PepsiCo, with a whopping 15% of total revenue. Image two shows the percentage of revenue to each group inside PepsiCo. While most revenues increase per group, the percentage changes based on strategy, economics, and other factors. Pepsi and Frito-Lay make up the vast amount of revenue per division, with Pepsi having 30% of all revenue while Frito with 27%. Interestingly enough, Fritos operations are catching up to Pepsi; at the same time, Latin America is also close to passing the EU’s operations because of the effects of the war with Russia. Overall, revenue growth is healthy throughout the company’s divisions year-to-year and quarter-to-quarter.
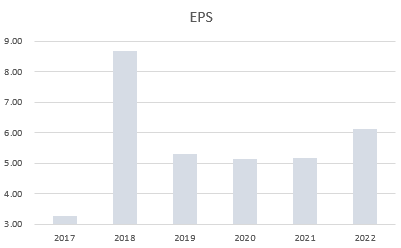
EPS data went up in 2022 by 18%, meaning PepsiCo made $6.13 for every share outstanding. In addition, from 2017 till now, PepsiCo had a share buyback of 3%, from 1.425 billion shares to 1.38 billion, indicating that it has the capital to spend and invest in itself. As a result, model income (net income excluding one-time purchases) was reasonably aligned with net income, although the same cannot be said for a per-quarter basis. Model income was far off to net income based on the Justice Transaction and Intangible Asset Impairment that will be spoken about in more detail.

The gross margin in image 4 shows that the selling of goods, when factoring in the cost of sales, has remained relatively stagnant, decreasing just about 3% in the last five years. Operating profit margin indicates a decrease of 3%, meaning that when adding expenses, such as selling general and administrative costs and other expenses, it has taken a more significant cut than previously in terms of net profit. Return on equity (ROE) shows the company’s growth or decline in net assets. The S&P’s long-term running average of ROE is 13.29%, whereas the average for food and soft beverages combined is 21.05 ROE. PepsiCo’s ROE for 2022 was 49%, exhibiting consistency in its assets. Return on assets (ROA), on the other hand, shows the amount of profit a company can generate with its assets. PepsiCo’s ROA is 9.2% in 2022 and has been growing for three years. The debt ratio is total short-term debt plus long-term debt divided by assets. PepsiCo displayed a 42.4% debt ratio, meaning there’s over 40% of debt per asset. The average in the food and beverage industry is 22%, meaning PepsiCo is taking on more debt than other companies in its industry. Lastly, the asset turnover ratio indicates the efficiency of a company using its assets to generate revenue. Consumer non-cyclical companies have an average turnover of .72, while PepsiCo has an average of .94, which has increased by about 13% in the past five years.
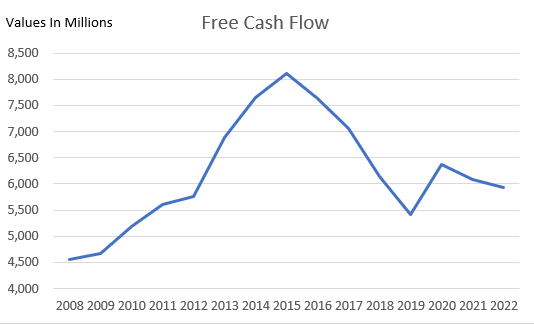
Free cash flow is one of the most important metrics used to gauge the amount of money PepsiCo takes as profits due to cash inflows and outflows (cash from operating activity – capital expenditures). Since 2008, PepsiCo has been making positive cash flows and doubling its cash inflows. However, in 2016, the conglomerate lost 6% cash flows from operations based on previous years; this means that instead of bringing back 8.1 billion dollars in profit, they took 7.6 billion. In addition, free cash flow losses year to year started to accelerate in 2018, where free cash flow was down 13% year to year and is still in a downward spiral. Consecutive decreasing cash flows year to year could be concerning because PepsiCo will need more flexibility to spend the profits how they choose instead spending their money on necessities to keep the business running.
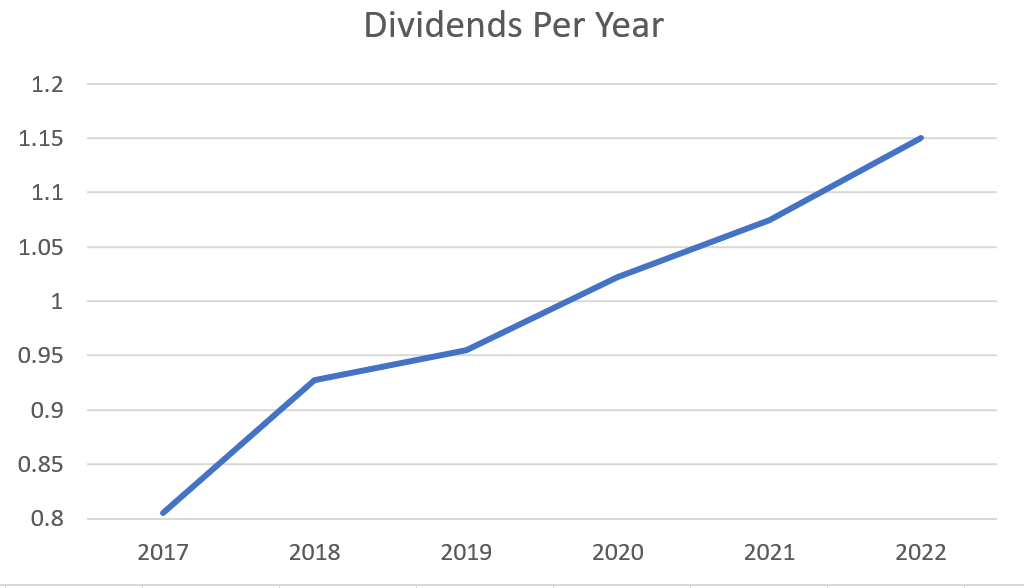
PepsiCo is a ‘dividend king’; even with decreases in cash flow, PepsiCo has continued to increase its dividends every single year. This boasts strength and gives the image that PepsiCo is doing exceedingly well. Dividends are the amount of stock the company pays back to its shareholders at a given period before the ex-dividend date; they do this to provide an incentive to hold the stock by sharing profits. Another portrayal of PepsiCo’s strength is the employee numbers. In 2017, PepsiCo had 263,000 employees; today, there are 315,000 employees. The company is investing a hefty portion of its money on both dividends and employees.
The Justice Transaction was a recent addition that made Q1 earnings look better than most of PepsiCo’s quarters because it’s a one-time gain. PepsiCo sold Naked Juice and Tropicana for 3.32 billion dollars to PAI partners (another conglomerate investing in companies). Q2 and Q4, on the other hand, suffered a blow because of one-time expenses from asset impairment. The cause of asset impairment was primarily due to the war in Russia; this affected operations Pepsi had in Europe. PepsiCo lost about 2 billion dollars due to the war in Russia because of a subsidiary named Wimm-Bill-Dann Foods which controls roughly 34% of dairy products in Russia. Another necessary expense that should be addressed is the TCJ Act expense. This act was implemented when Donald Trump was president and decreased the amount companies pay in taxes, including higher income bracket individuals. PepsiCo owes 2.6 billion dollars in taxes, for which it has already paid off about 1.543 billion dollars and plans on paying off an additional 309 million by the end of 2023.
Valuation
For my analysis, I assumed that the food and beverage industry grows 5% yearly and that PepsiCo’s revenue weight compared to its competitors stayed relatively the same. I calculated that PepsiCo’s weighted average cost of capital (WACC) is 7.46%, the terminal rate is 3%, and the net present value of all future cash flows is 231,145.9 billion. With this information, I project PepsiCo’s value relative to the discounted cash flows in net present value is equal to $166.65 per share (net present value divided by shares outstanding). This means that the intrinsic value shareholders believe to be the fair value equals $166.65 per share.

PepsiCo’s stock chart for image 10 shows that it is currently in a rising wedge on a weekly timeframe. Breakouts from these types of wedges can occur in any direction, but historically, the stock price will fall 60% of the time. Image 11 also shows confluence when assessing that PepsiCo is likelier to fall than go up. This image shows a bearish divergence, meaning the stock price is increasing while its relative strength index (RSI) (in purple) is decreasing. The oscillator shows that the current trend is weakening when the price and RSI are moving in opposite directions. Putting both indicators together and accounting for the 200-day moving average (the average price for 200 days on a weekly time frame), PepsiCo could see a possible 12% decline or a share price of $151 if the price moves to the 200 EMA line. If the price of PepsiCo breaks below the 200 EMA, then the price could also reach the 1.618 Fibonacci line at a price point of $135. Putting these factors together, if the price declines to these levels, it would be below the fair value of $166.65 and could be a reasonable price point for investors.
PepsiCo continues to stay at pace with its competitors, occupying 30% of its revenue compared to large conglomerates, including Coca-Cola, Nestle, and Anheuser. Declining free cash flow isn’t a substantial concern because PepsiCo is paying higher dividends, employee salaries, and TCJ act tax, which cuts free cash flow. In addition, the revenue sources are healthy and growing; Europe is the only revenue source that has declined based on intangible asset impairment and other sources of revenue decline caused by the war in Ukraine.