
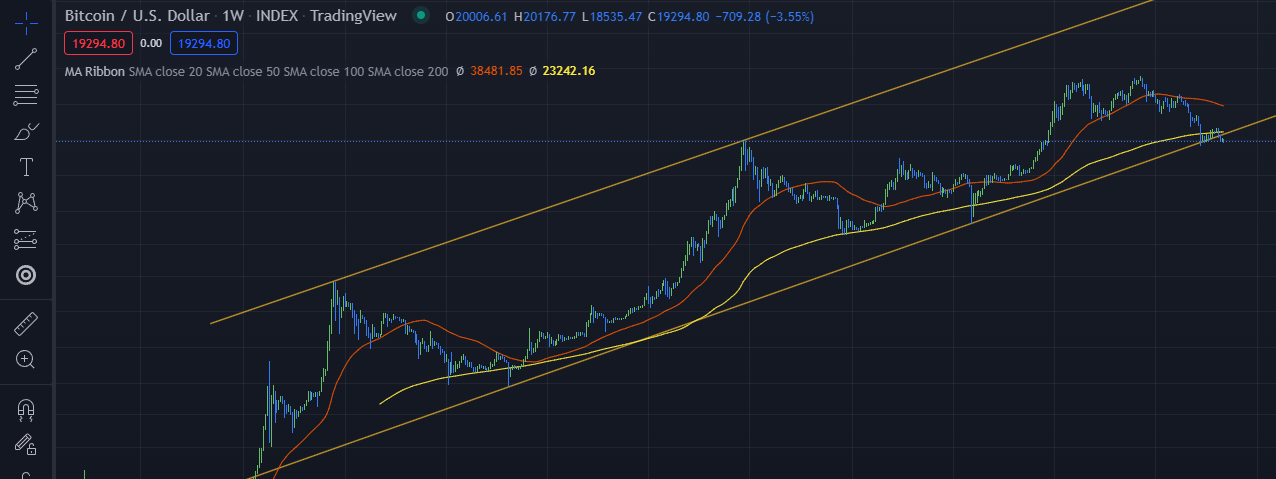
Bitcoin has been struggling to keep up in terms of price with the world economy taking further nose dives down because of interest rate hikes and inflation. One of the most famous Bitcoin charts is known as the rainbow chart, it has been prevalent since 2013. The rainbow chart is a channel that constantly goes up as time goes on, there’s a high of the channel and a low of the channel that has been hit three times. Many traders refer to this chart as the single most important chart for Bitcoin because it contains the bulk of its history and has been respecting the channel since it was found; that was until this year. For the first time in history bitcoin has now gone below the rainbow channel and can continue to spiral even lower, leaving a lot of long term investors in fear but also in joy for those that want to invest at a ‘discount’ price.
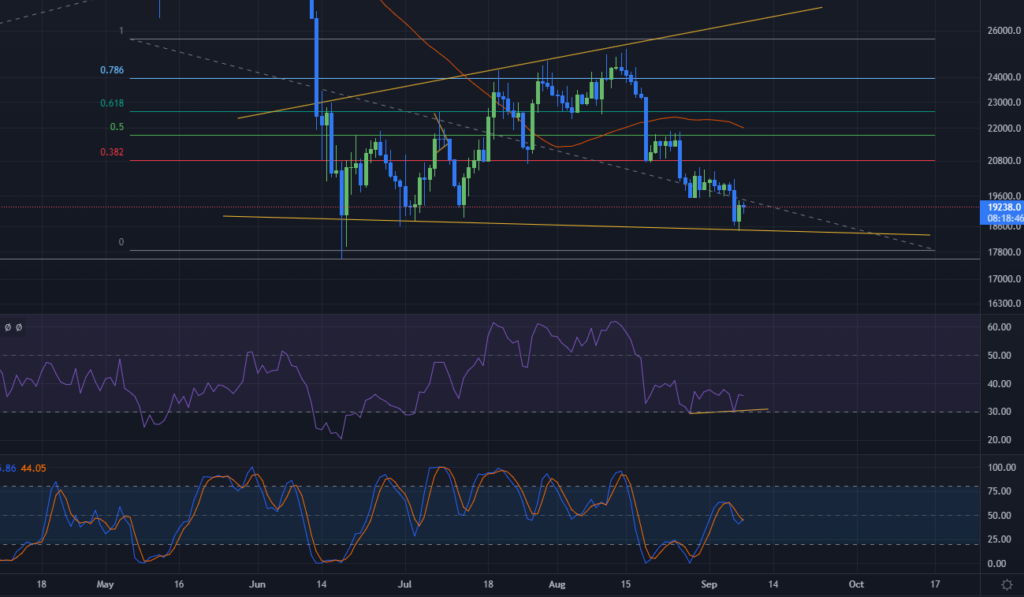
On the daily timeframe you can see that there is a broadening wedge. This is a wedge that hits most of the highs and the lows consistently, the top of the wedge is increasing while the bottom is decreasing, giving it the name broadening wedge. During July, Bitcoin was doing well by creating higher highs but it began to see a slowdown during the month of August. It was using the green .618 Fibonacci level as support but at the same time being sold off at the top of the wedge. While it was still creating higher highs, those highs started to become weaker. When the first big drop happened in mid August There was a candle close right at the .382 level near the wick off at the end of July, this is where bitcoin tested whether this double bottom was going to test the previous high or fail and dip lower. It then was obvious that Bitcoin failed and kept making new lower lows losing all the progress that it made. So why is this important? It’s important to know the current trend and price action of a trade so you can equip yourself with a good buy opportunity or take a good trade. What’s known so far is that bitcoin has made lower lows and has no chance of testing up to higher levels until it breaks the previous high of 20577, if it fails once again to get above this level, there’s a high chance that it will make new lows.
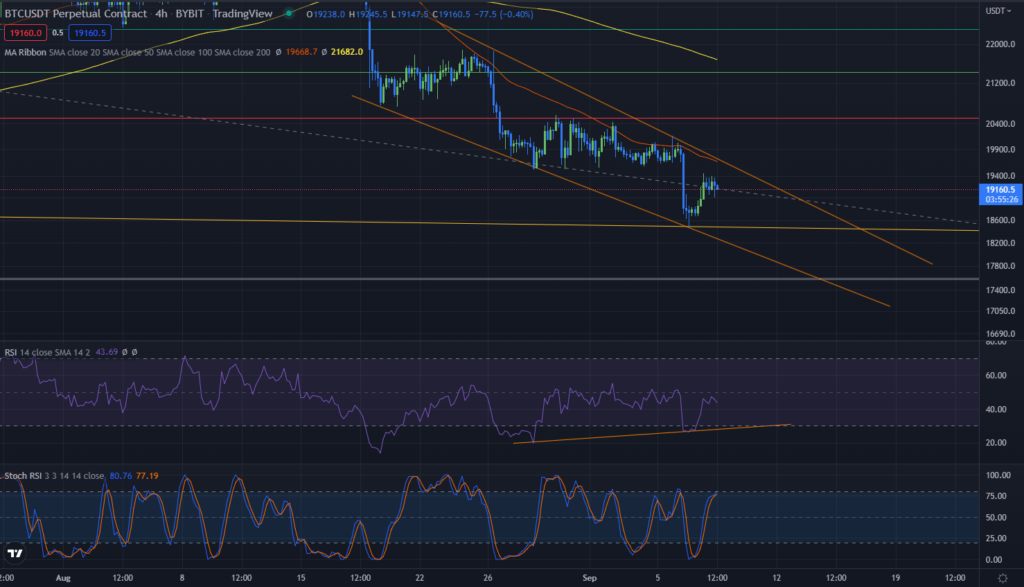
Here is a close look at what’s happening on a shorter time frame. Shorter time frames make up what happens in the larger time frames, so it’s always important to check every time frame and use it to your advantage. On the 4 hour you get a closer look at what’s happening on the daily, it’s obviously making lower lows and higher lows pushing the price down further. Something that’s noticeable that’s harder to see on the daily is that there’s a falling wedge and price action is shrinking, meaning the candle sticks have less space which in the end causes a huge explosion in price when it escapes the wedge. In Bulkowski’s website, he says that this type of wedge has a 68% chance of breaking to the upside once it exits the wedge. Keep in mind while it’s breaking to the upside at first, it’s very possible for the price action to bait out traders and come to the downside right after a huge price swing up. The relative strength index (RSI for short) tells if a securities price is overbought or oversold and is used to show if there are any divergences. A divergence tells you a weakness in price level, for example in the above chart, the RSI make a higher low while the price level of bitcoin itself made a lower low showing a weakness of people that are selling, eventually leading the price to go up briefly. What’s certain is that on the 4 hour timeframe the price must exit the wedge in order to see which direction bitcoin can break out of. If it breaks up, it has a chance of retesting the 20577 level and creating a higher high pushing the price up further, if it breaks lower, there could be a possible double bottom at 17600.
If you didn’t understand Market sentiment, meaning higher highs or lower lows I will make a post explaining it in further detail as well as how to use other oscillators and trading methods. For now, here are some links to help you get started on learning what each is:
https://www.investopedia.com/terms/m/movingaverage.asp
https://thepatternsite.com/fallwedge.html